Deciphering COVID-19 Chest X-rays with VGG16: AI's Diagnostic Edge
Introduction
Understanding COVID-19 Chest X-rays
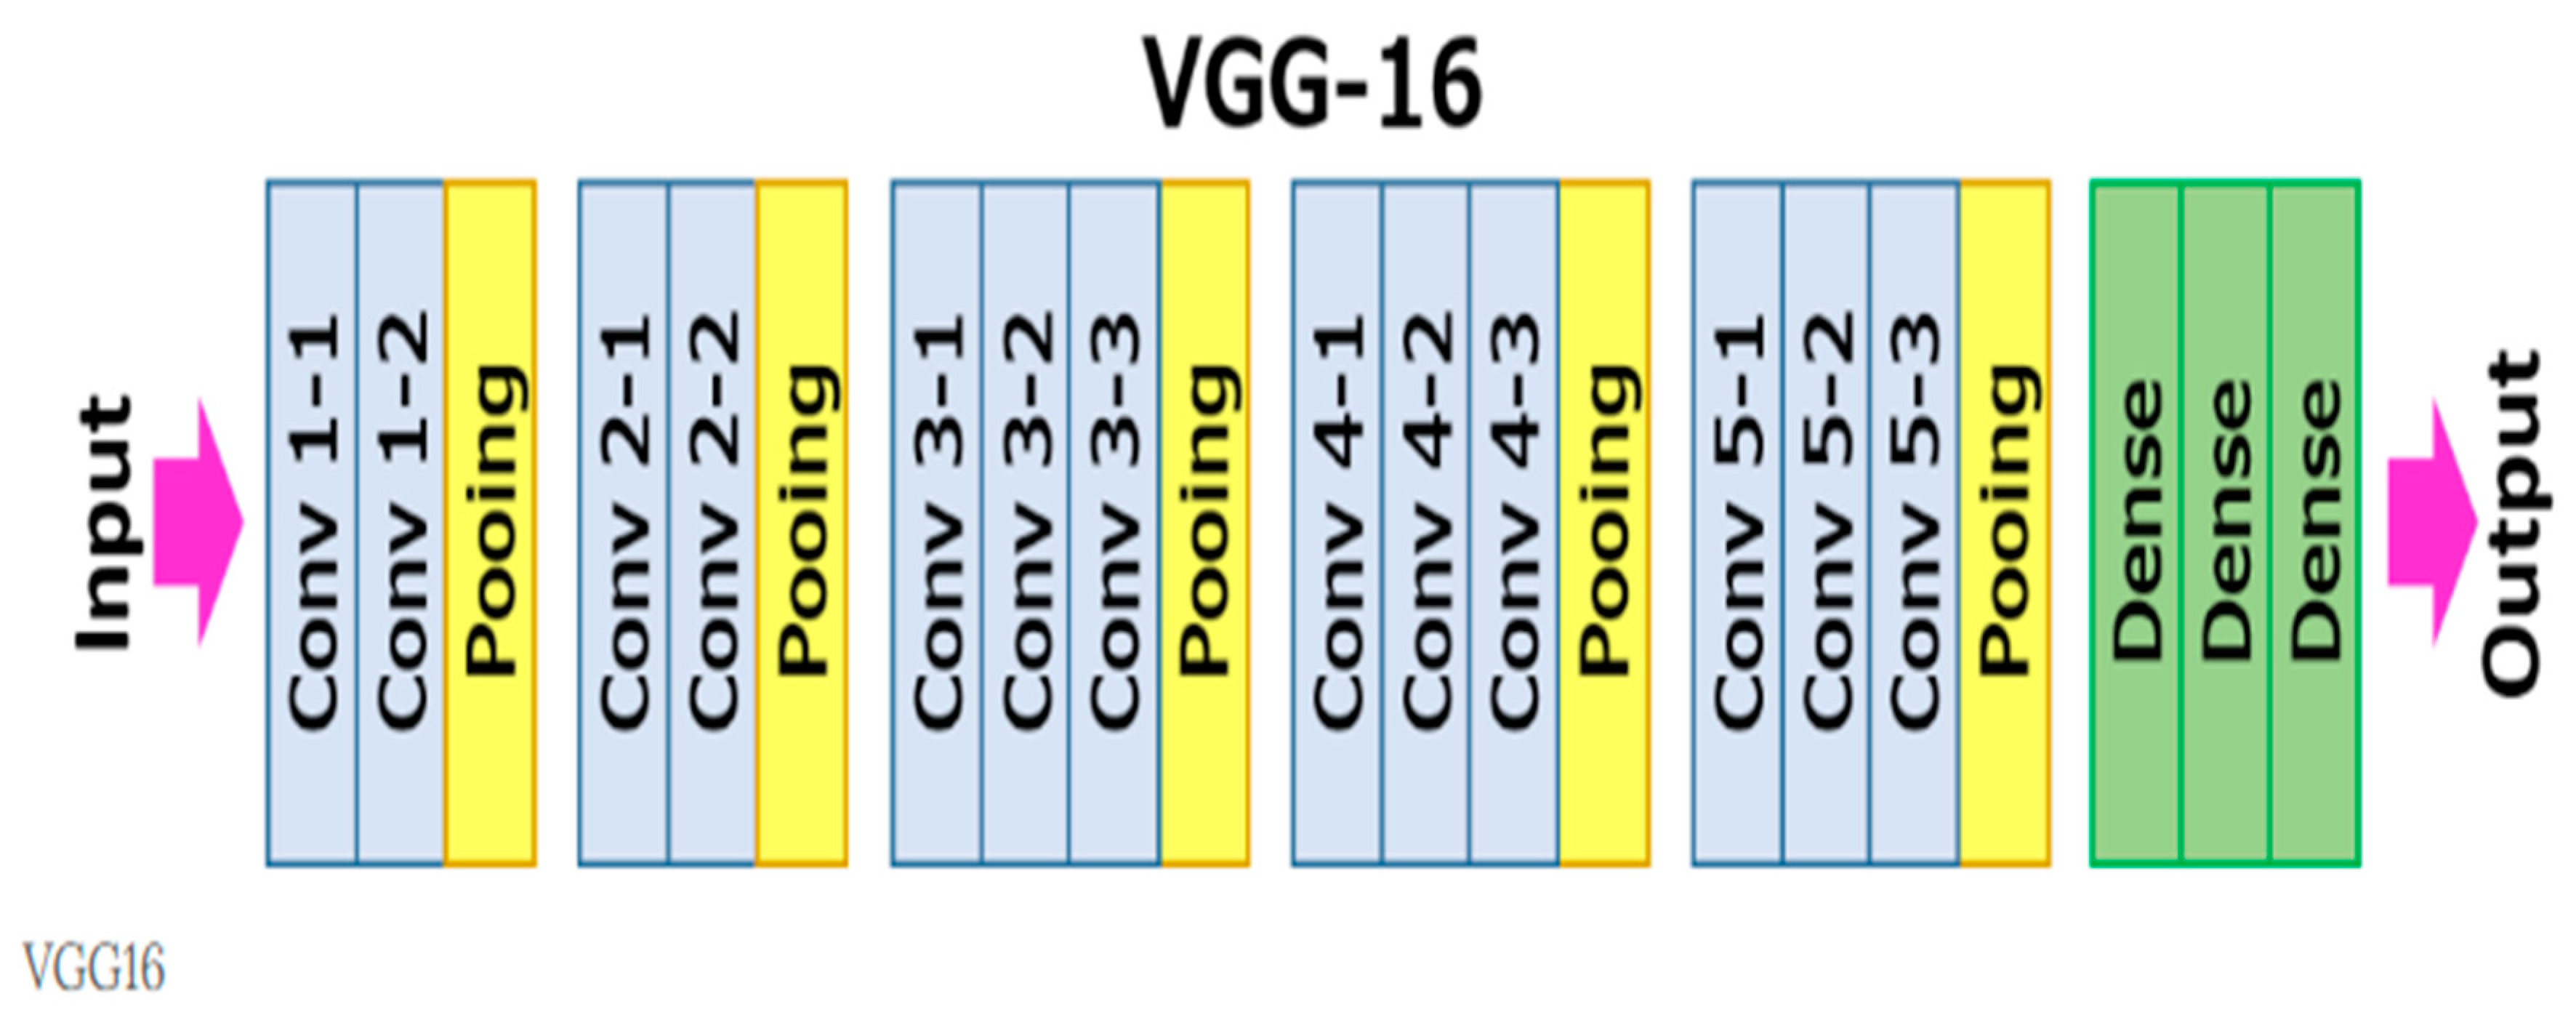
VGG16: A Brief Overview
Transfer Learning and Pre-trained Models
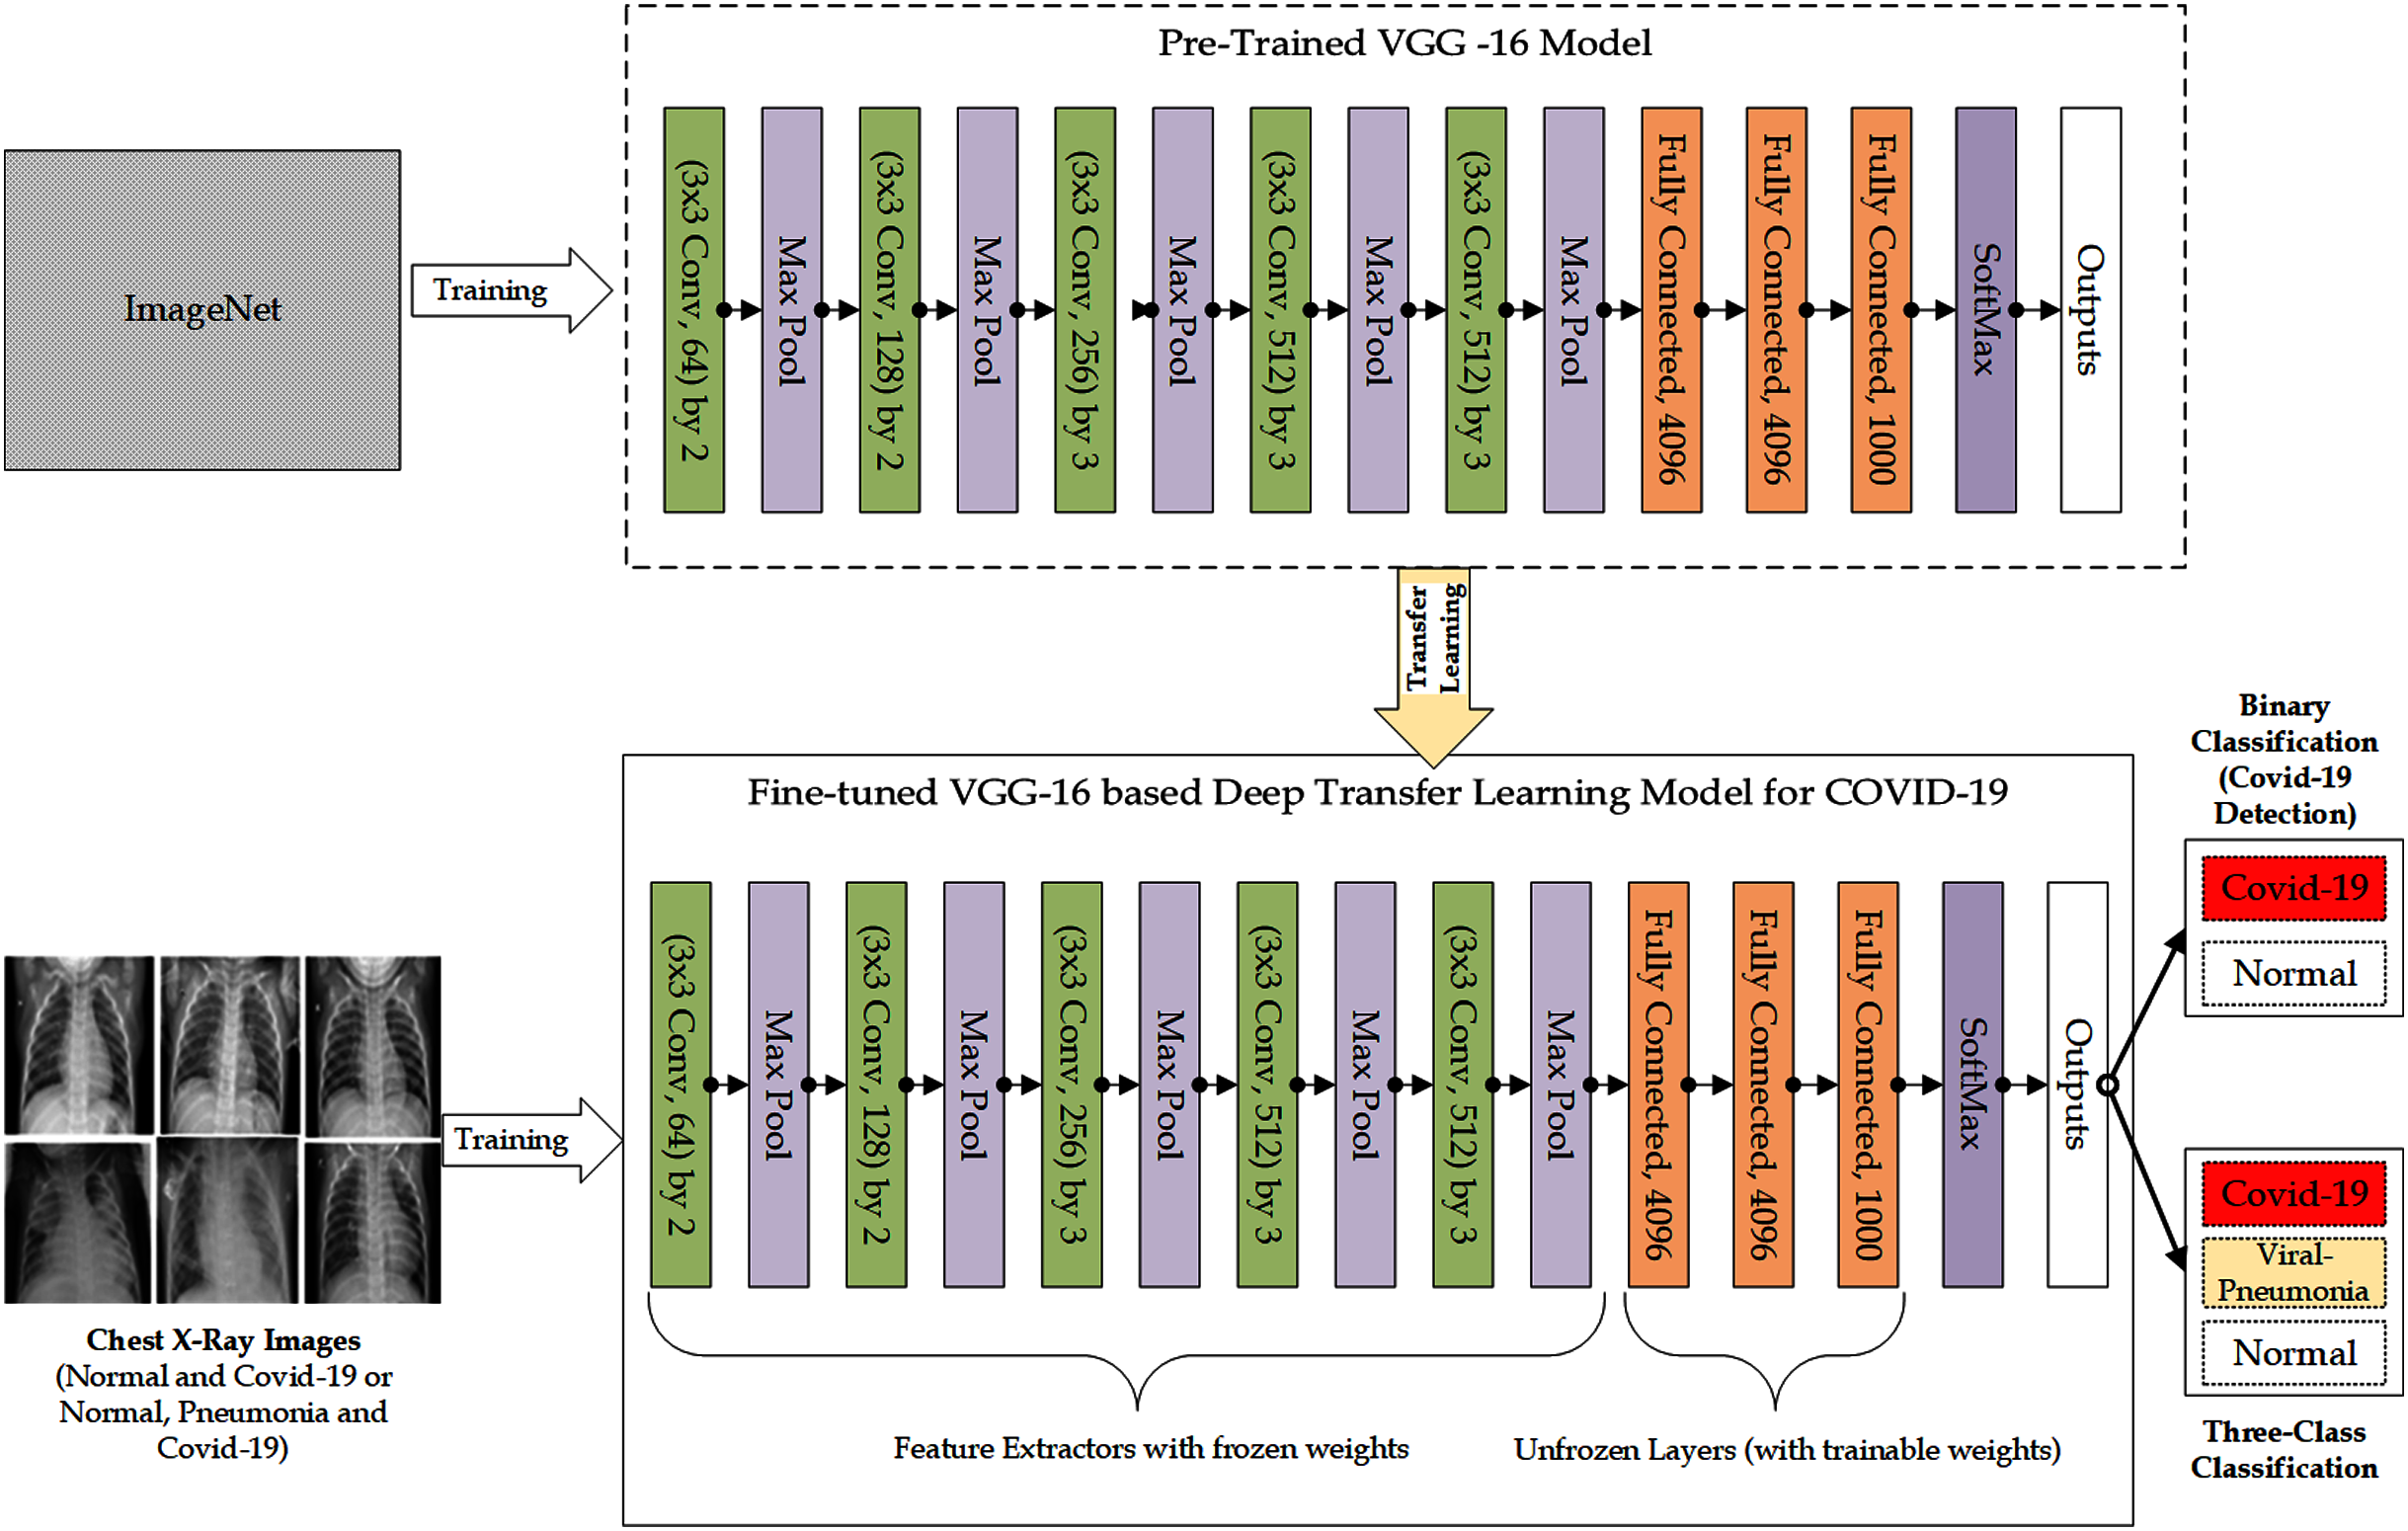
Methodology
Benefits and Challenges
Code:
|
# How to link Kaggle to Colab # Import necessary libraries import numpy as np import tensorflow as tf from tensorflow.keras.applications import VGG16 from tensorflow.keras.preprocessing.image import
ImageDataGenerator from tensorflow.keras.layers import Dense, GlobalAveragePooling2D from tensorflow.keras.models import Model
# Load pre-trained VGG16 model (without top layers) base_model = VGG16(weights='imagenet', include_top=False,
input_shape=(224, 224, 3))
# Freeze the base model's layers for layer in base_model.layers: layer.trainable = False
# Add custom classification layers x = base_model.output x = GlobalAveragePooling2D()(x) x = Dense(128, activation='relu')(x) predictions = Dense(2, activation='softmax')(x) # Two classes: COVID-19 and Negative
model = Model(inputs=base_model.input, outputs=predictions)
# Compile the model model.compile(optimizer='adam', loss='categorical_crossentropy',
metrics=['accuracy'])
# Data preprocessing and augmentation for training and validation train_datagen = ImageDataGenerator( rescale=1./255, rotation_range=20, width_shift_range=0.2, height_shift_range=0.2, shear_range=0.2, zoom_range=0.2, horizontal_flip=True, fill_mode='nearest')
validation_datagen = ImageDataGenerator(rescale=1./255) # No augmentation for validation
train_generator = train_datagen.flow_from_directory( 'path/to/training_data', target_size=(224, 224), batch_size=32,
class_mode='categorical')
validation_generator = validation_datagen.flow_from_directory(
'path/to/validation_data', target_size=(224, 224), batch_size=32,
class_mode='categorical')
# Train the model with validation steps history = model.fit(train_generator, epochs=10, steps_per_epoch=len(train_generator),
validation_data=validation_generator,
validation_steps=len(validation_generator)) import matplotlib.pyplot as plt # Plot training and validation metrics plt.figure(figsize=(12, 4)) # Plot training & validation accuracy values plt.subplot(1, 2, 1) plt.plot(history.history['accuracy']) plt.plot(history.history['val_accuracy']) plt.title('Model Accuracy') plt.xlabel('Epoch') plt.ylabel('Accuracy') plt.legend(['Train', 'Validation'], loc='upper left')
# Plot training & validation loss values plt.subplot(1, 2, 2) plt.plot(history.history['loss']) plt.plot(history.history['val_loss']) plt.title('Model Loss') plt.xlabel('Epoch') plt.ylabel('Loss') plt.legend(['Train', 'Validation'], loc='upper left') plt.tight_layout() plt.show() # Save the trained model model.save('covid19_vgg16_model.h5') |


0 Comments